
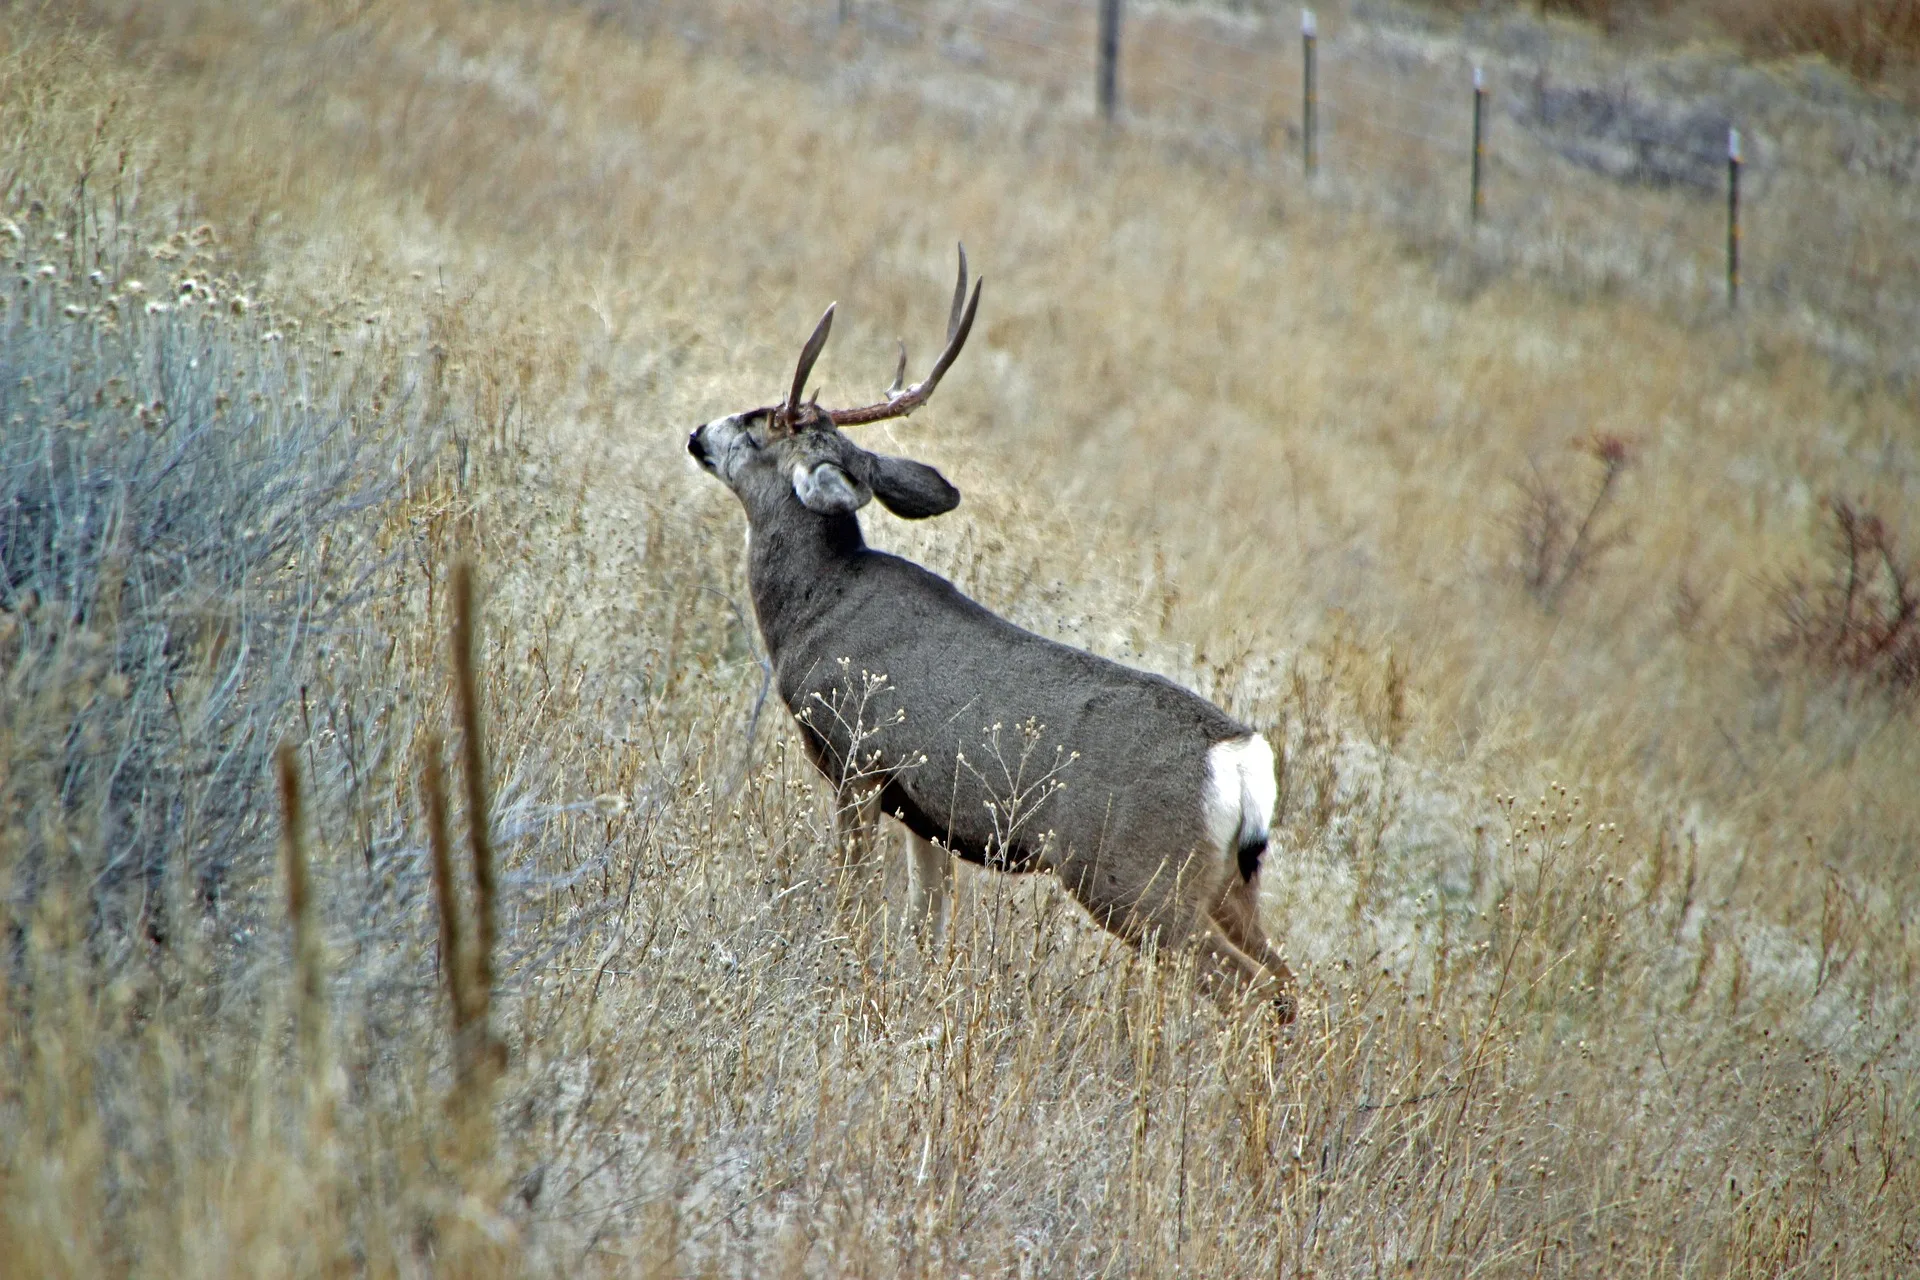
Wildlife biologists recently completed mule deer aerial spring surveys across southeast Montana’s Region 7, and for the third straight year the total number of observed mule deer and overall densities have increased.
Currently, mule deer numbers are still approximately 17 percent below the long-term average but have been trending up in recent years. As a result, there are more mule deer out on the landscape, which will equate to more opportunity this fall.
“The past few years we have received favorable moisture during key periods, which improved habitat and forage across southeastern Montana and has helped out the mule deer as they have been recovering from multiple years of severe drought,” said regional wildlife manager Brett Dorak. “We are excited to see numbers rebounding, but so far this spring has been pretty dry, and more spring rains would really help the range conditions for everything out there.”
Despite some variation across the region, a majority of the trend areas surveyed showed an increase in total mule deer counts this spring compared to survey data from 2025. Overall, recruitment ratios are strong, and this year’s surveys showed 55 fawns per 100 adults, which is only 5 percent below the long-term average.
Every spring, Region 7 wildlife biologists conduct aerial surveys across 15 deer trend areas (DTAs) in the region to assess mule deer trends in total observations and recruitment ratios.
Fawns that have survived their first winter, which is typically the hardest period in the annual cycle, are considered recruited into the population. These ratios can help inform FWP on overall winter survival, how the population is faring as it enters the spring season, and what the potential for growth might be in the upcoming year.
Mule deer in eastern Montana are cyclical and typically operate in a 10-year cycle. With survey data going back over four decades, FWP has observed lows in 1988, 1997, 2012, and recently in 2023. Following those periods, growth is typically observed until another weather-related factor (i.e., harsh winters or severe droughts) impacts the populations and the cycle starts again.
Sidney Area Summary
Within the Sidney biologist district, mule deer numbers increased across all areas surveyed, with total counts at both trend areas above the long-term average. Additionally, the ratio of mule deer fawns per 100 adults indicates a high level of fawn over-winter survival.
These trends are very optimistic, likely driven by favorable habitat conditions, mild winters, and strong fawn recruitment over the past few years.
Glendive area summary
Spring 2026 mule deer surveys in the Glendive area showed generally positive conditions following a mild winter and early spring green-up. Mule deer numbers varied across the area, with some portions remaining slightly below long-term averages while others were well above average and improved compared to last year. Fawn numbers were generally good across the area, indicating strong over-winter survival. Overall, survey results suggest mule deer came through the winter in good condition, with stable to improving numbers across the area.
Broadus area summary
Mule deer population status varies across the Broadus district. Numbers are still struggling in the southern two-thirds of Hunting District 705, whereas populations are further along in recovery generally between the Powder and Tongue rivers. Fawn recruitment is near to well above average on all trend areas, which will hopefully aid in the continued recovery from recent lows due primarily to extreme drought in 2020-2021.
Forsyth area summary
The number of mule deer varies across the Forsyth district. In general, data collected from the two mule deer trend areas in Hunting District 702 indicate populations remain below long-term averages, whereas the trend area in Hunting District 701 is slightly above its long-term average.
It is important to recognize that, historically, habitats within the portion of the Forsyth district south of Interstate 94 have supported higher densities of mule deer. For example, one trend area in HD 702 has historically averaged approximately three deer per square mile, while the trend area north of Interstate 94 in HD 701 averages approximately 1.6 deer per square mile. Consequently, although mule deer numbers south of the interstate remain well below average, deer densities there are still higher than those observed north of the interstate at a broad landscape scale.
“As an area biologist, I view these population summaries at a broad, landscape scale encompassing thousands of acres,” said wildlife biologist Steve Atwood. “At the same time, when visiting with hunters or landowners, I try to remain mindful and respectful that localized conditions may differ from broader population trends. While overall deer numbers may be increasing across a large area, the specific area most familiar to an individual, such as a particular creek drainage, may still be experiencing lower deer numbers.”
Source: Montana FWP
Photo: Pixabay
Montana's outdoor week, in your inbox at 7am Friday.